The digital retail world is highly competitive, and only data serves as the guide to long-term development. Although the majority of store owners are ecstatic because of an increase in the number of people visiting the store daily, experienced entrepreneurs understand that the number of visitors is just a measure of vanity unless it leads to profit. To create a strong brand, you need to know what ecommerce kpis to track for online store , not just superficial measures but profound performance metrics.
A lot of businesses fail due to the emphasis most of them have on the top-of-funnel volume rather than the ecommerce metrics to improve conversions that make the business viable. With the help of surgical adjustments to your strategy, you can detect where your revenue is leaking, high rates of drop-offs at checkout, or low repeat purchases. The surest way to make more money is by using data to optimize, which enables you to get the maximum out of each visitor. Companies that are constantly at the forefront of their niche usually hire a CRO Expert Company to help identify the high level data points that actually have a bottom line impact, and those that are mere noise. This guide discusses the key KPIs that each store should track to transform raw data into an effective sales and profitability driver in the long term.
What Are Ecommerce KPIs and Why Do They Matter?
Ecommerce Key Performance Indicators (KPIs) are the measurable values which are used to assess the effectiveness with which a company is meeting its important business goals. It is crucial to differentiate between general metrics and KPIs: whereas any process is monitored with the help of a metric (such as social media likes), Monitor the important ecommerce KPIs for business growth. These indicators serve as a diagnostic instrument, which displays the health of your sales funnel and where exactly the friction is taking place.
What is the significance of this? Since KPIs make the decisions that result in revenue. Using data to make decisions instead of the gut feeling will make sure that your marketing budget is used wisely and your website structure is in your favor. To remain on top, it is a good idea to do a regular CRO Audit to allow businesses to understand the areas of their performance that are lacking and focus on the ones that make the biggest difference. Ecommerce performance metrics to track for ensuring that you observe the metrics and, therefore, have the transparency to streamline the user experience, minimize friction, and eventually achieve greater sales in your entire online storefront.
7 Ecommerce KPIs You Should Track to Increase Sales and Conversions
1. Conversion Rate
The conversion rate is the “North Star” of ecommerce conversion rate metrics to track. It represents the percentage of visitors who complete a purchase out of the total number of visitors.
- Why it matters: It is the primary indicator of your site’s effectiveness.
- The Impact: Even a 0.5% increase can result in thousands of dollars in monthly revenue without increasing ad spend.
- Benchmark: While it varies by industry, a healthy ecommerce benchmark usually hovers between 2% and 3%.
Low conversion rates often signal a disconnect between your ads and your landing pages, or technical friction during the buying process. Specifically, many conversion issues are caused by common Shopify checkout mistakes, such as forced account creation, lack of guest checkout options, or overly complicated payment steps.
2. Average Order Value (AOV)
AOV tracks the average dollar amount spent each time a customer places an order. While conversion rate focuses on the number of sales, AOV focuses on the value of those sales. Increasing your AOV is one of the fastest ways to boost revenue without increasing your marketing spend.
- Bundles: Grouping related items for a small discount.
- Upsells: Recommending a premium version of the product currently in the cart.
- Free shipping threshold: Offering “Free shipping on orders over $100” to nudge customers to add one more item.
Furthermore, understanding ecommerce psychology helps encourage customers to spend more through strategic anchoring and pricing strategies that make higher-value carts feel like a logical choice rather than an extra expense.
3. Cart Abandonment Rate
This KPI measures the percentage of shoppers who add items to their cart but leave before finishing the transaction. It is perhaps the most frustrating metric for store owners, as it represents revenue that was “almost” won.
- Common Causes: High shipping costs revealed too late, complicated checkouts, or slow website speeds.
- The Solution: Continuous A/B Testing for Shopify helps identify which checkout layouts, trust badges, and limited-time offers effectively reduce cart abandonment. By testing different configurations, you can find the perfect balance that keeps users moving toward the final “Thank You” page.
4. Customer Acquisition Cost (CAC)
CAC is the total cost of sales and marketing efforts required to acquire a single new customer. In an era of rising ad costs, keeping your CAC lower than your profit per customer is essential for survival.
- Improve Targeting: Focus on high-intent keywords and audiences.
- Increase Conversion Rate: The better your site converts, the lower your effective CAC becomes.
- Optimize Channels: Identify which platforms (Google, Meta, TikTok) provide the best return on investment.
5. Customer Lifetime Value (CLV)
CLV represents the total amount of money a customer is expected to spend in your store during their entire relationship with your brand. High-growth businesses focus on CLV because retaining an existing customer is significantly cheaper than acquiring a new one.
- Email Marketing: Keeping your brand top-of-mind with personalized offers.
- Loyalty Programs: Rewarding repeat purchases to build long-term affinity.
- Retargeting: Using ads to bring previous buyers back for new product launches.
6. Revenue Per Visitor (RPV)
RPV is a comprehensive KPI that combines conversion rate and AOV into a single number. It is calculated by dividing total revenue by total visitors. It tells you exactly how much each visitor is worth to your business. If your conversion rate drops slightly but your AOV skyrockets, your RPV might actually go up, indicating that your business is becoming more profitable even with fewer total transactions.
7. Bounce Rate
Bounce rate measures the percentage of visitors who land on a page and leave without interacting with it. A high bounce rate is a clear signal of friction. To reduce it, you should:
- Optimize page load speeds.
- Ensure the landing page content perfectly matches the ad that brought the user there.
- Improve the “above the fold” visual appeal to build immediate trust.
How to Track Ecommerce KPIs Effectively
To manage your ecommerce performance metrics to track, you need a robust technological foundation. It is not enough to simply collect data; you must be able to interpret it in real-time.
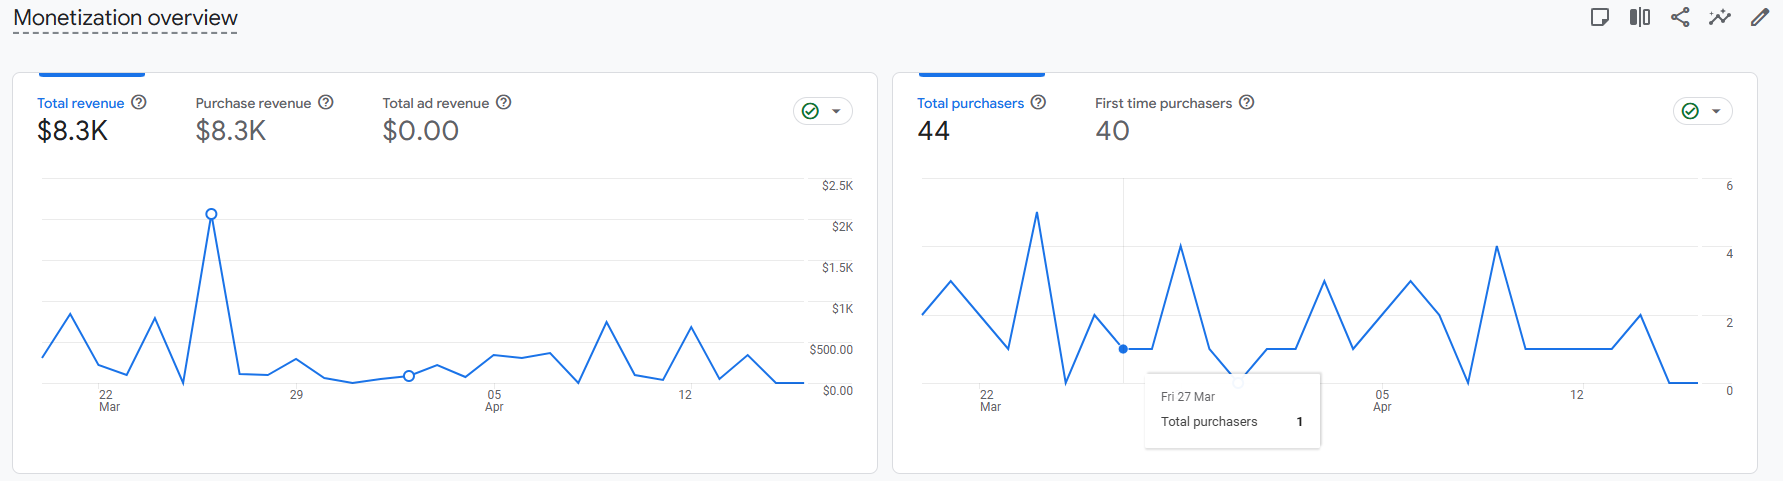
- Google Analytics 4 (GA4): Essential for tracking user journeys, events, and conversion paths across devices.
- Shopify Analytics: Provides excellent native reporting on sales trends and customer behavior.
- Heatmaps (Hotjar/Clarity): These reveal why users are behaving a certain way by showing where they click and how far they scroll.
- Conversion Tracking: Ensuring every “Add to Cart” and “Purchase” event is accurately firing in your ad managers.
Effective tracking requires setting clear, time-bound goals and monitoring ecommerce analytics metrics for online store performance on a weekly basis. You must track every stage of the funnel from the first click to the final purchase to spot emerging trends before they become expensive problems.
Common Mistakes When Tracking Ecommerce KPIs
Despite the availability of modern tools, most store owners make typical data pitfalls that prevent growth:
- Tracking too many metrics: Trying to watch 50 different numbers leads to “analysis paralysis.” Concentrate on the Vital Few who push the needle.
- Ignoring the Conversion Rate: Other owners think that an increase in traffic will solve everything. Unless your site is converting, increased traffic will only translate to additional wasted advertising dollars.
- Not Analyzing Customer Behavior: Numbers will answer the question of what but qualitative data will answer the question of why.
- Focusing on Traffic over Revenue: It is less valuable having 10,000 visitors who do not purchase anything as compared to having 100 visitors who purchase all.
- Not Testing Changes: The practice of updating the site with personal preference instead of basing it on the evidence of the data tends to lead to performance decreases.
Final Verdict: Focus on the KPIs That Drive Revenue
In the dynamic environment of online shopping, the ability to monitor the appropriate KPIs is what can make the difference between a store that barely covers the expenses and the one that conquers its market. Optimization is not a one-time process, but a recurring process of monitoring, testing and refining. When you focus on the numbers that directly affect your bottom line, such as Conversion Rate, AOV, and CLV, you can be confident that all of your decisions are supported by the facts of user behavior.
Sustainable growth of ecommerce requires structured testing and critical analysis of data. When your store traffic is rising and your revenues are not growing, it is in your data. Monitoring the appropriate ecommerce KPIs can determine the points at which the customers lose the track, and how this problem can be addressed.
Are you ready to stop guessing? To maximize the potential of your store, begin by assessing your figures now. It could be a thorough ecommerce audit or an expert CRO consultation, but the first step toward making your store a high-performance sales machine is to find out what your biggest bottleneck is.